Kaa IoT setup
MQTT and HTTP are among the most popular protocols that are used for transferring all kinds of data. Both protocols are heavily utilized in different IoT setups, and they both are supported by RouterOS.
What kind of data, you might ask? Pretty much anything... RouterOS scripting is a very powerful tool that can help you automate your devices with the help of scheduling.
For example, you can check your system's resource information with the help of the command /system/resource/print :
/system/resource/print
                   uptime: 4d1h37m55s
                  version: 7.14.3 (stable)
               build-time: 2024-04-17 12:47:58
         factory-software: 6.45.9
              free-memory: 926.0MiB
             total-memory: 1024.0MiB
                      cpu: ARM
                cpu-count: 4
            cpu-frequency: 533MHz
                 cpu-load: 0%
           free-hdd-space: 88.5MiB
          total-hdd-space: 128.0MiB
  write-sect-since-reboot: 1107
         write-sect-total: 1447413
               bad-blocks: 0%
        architecture-name: arm
               board-name: RB1100AHx4
                 platform: MikroTik
This command shows you useful information, like CPU usage, RAM-memory usage, device's uptime and its firmware version. Another command will print out GPS coordinates (if the device has a GPS chip built-in) and so on...
What this means, essentially, is that anything that can be "printed out" into the RouterOS terminal, can be scripted to be structured into JSON format messages and sent out with a configured interval. We will showcase a more detailed example later on in the guide.
In other words, you are able to send the data from your MikroTik to any MQTT or HTTP server of your choice. Kaa IoT is one such server.
Kaa IoT configuration
Make sure to check KAA: Connecting your first device.
After you log into the portal, to start, follow the steps from the playbook:
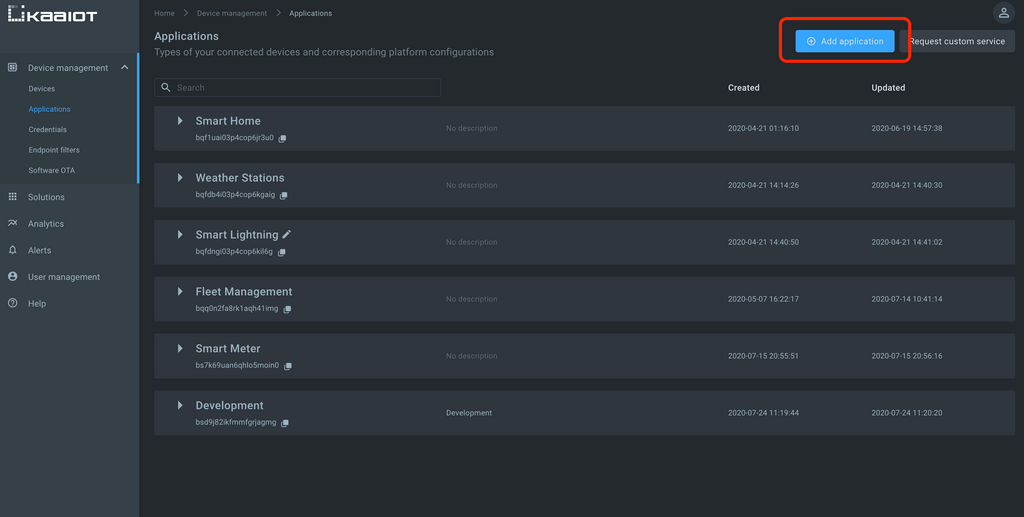
a) Create an application, under "Home>Device management>Applications", by clicking on the "Add application" button, name it, and "Create" it:
b) Create a device, under "Home>Device management>Devices", by clicking on the "Add device" button, name it, and "Create" it:
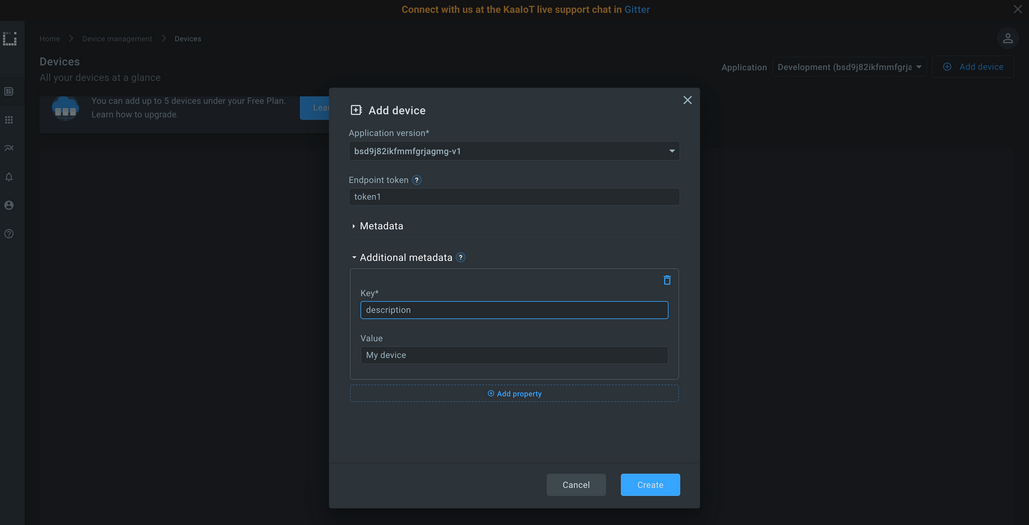
Input your own "Endpoint token" or let the system auto-generate one for you. Make sure to "save" it (because you will not be able to access it again).
All that is left is to connect our router to the server using MQTT or HTTP, post some data and customize our first dashboard to more easily visualize it.
RouterOS configuration
First things first, the device should have internet access. Check our First Time Configuration guide.
Once you have the Internet up and running, if you are planning to use MQTT protocol, make sure you have the iot package installed. You can download it from our download page, under the "Extra packages" file (for your device's respective architecture). Unzip the "Extra packages" file and upload the iot package to the "Files" (reboot the device after that). If you are planning on only using HTTP posting, there is no need for the iot package installation.
Before going further, visit Kaa IoT MQTT and HTTP device API guides.
Using HTTP to post the data
To post a basic JSON message:
{"test":"data"}
Simply run the command:
/tool/fetch url="https://next.kaaiot.com/kpc/kp1/<app-version>/epmx/<token>/update/keys" http-method=post http-header-field="Content-Type: application/json" http-data="{\"test\":\"data\"}" output= mode=https
, where you should change <app-version> (that you can check under the "Home>Devices management>Devices>Specific device" tab) and <token> (that you've generated after creating a device on the platform) to your respective values.
You should be able to see that a new "Metadata" value appeared under the "Home>Device management>Devices>Specific device>Overview" tab or check logs under the "Home>Device management>Devices>Specific device>Data logs" tab.
To collect /system/resource/print information and post it, we can use scripting. Copy and paste the content of the script shown below into the command line:
/system/script
add dont-require-permissions=no name=systeminfo owner=admin policy=\
ftp,reboot,read,write,,test,password,sniff,sensitive,romon source="#####################\
############### System ###################################\r\
\n:put (\"[*] Gathering system info...\")\r\
\n:local cpuLoad [/system/resource/get cpu-load];\r\
\n:local freeMemory [/system/resource/get free-memory];\r\
\n:local usedMemory ([/system/resource/get total-memory] - \$freeMemory);\r\
\n:local rosVersion [/system/package/get value-name=version \\\r\
\n[/system/package/find where name ~ \"^routeros\"]];\r\
\n:local model [/system/routerboard/get value-name=model];\r\
\n:local serialNumber [/system/routerboard/get value-name=serial-number];\r\
\n:local upTime [/system/resource/get uptime];\r\
\n\r\
\n#################################### message #####################################\r\
\n:local message \\\r\
\n\"{\\\"model\\\":\\\"\$model\\\",\\\r\
\n\\\"sn\\\":\\\"\$serialNumber\\\",\\\r\
\n\\\"ros\\\":\\\"\$rosVersion\\\",\\\r\
\n\\\"cpu\\\":\\\"\$cpuLoad\\\",\\\r\
\n\\\"umem\\\":\\\"\$usedMemory\\\",\\\r\
\n\\\"fmem\\\":\\\"\$freeMemory\\\",\\\r\
\n\\\"uptime\\\":\\\"\$upTime\\\"}\"\r\
\n\r\
\n:log info \"\$message\";\r\
\n:put (\"[*] Total message size: \$[:len \$message] bytes\")\r\
\n:put (\"[*] Sending message...\")\r\
\n/tool/fetch url=\"https://next.kaaiot.com/kpc/kp1/<app-version>/epmx/<token>/up\
date/keys\" http-method=post http-header-field=\"Content-Type: application/json\" http-data=\
\"\$message\" output= mode=https\r\
\n:put (\"[*] Done\")"
Change the URL's <app-version> and <token> values. Then, run the script using:
/system/script/run systeminfo
The JSON message will look like this:
{
  "model": "RB924iR-2nD-BT5&BG77",
  "sn": "XXXXXXX",
  "ros": "7.99",
  "cpu": "7",
  "umem": "45113344",
  "fmem": "21995520",
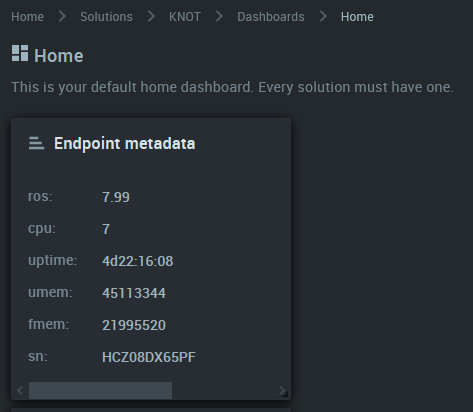
  "uptime": "4d22:16:08"
}
Using MQTT to post the data
In order to use a one-way SSL MQTT scenario, get the root certificate from "Home>Device management>Credentials" by clicking on the "Get root certificate" button. More info can be found here.
Upload the ca.pem certificate file to RouterOS and import it using:
/certificate/import file-name=ca.pem passphrase=""
Add a new MQTT broker:
/iot/mqtt/brokers
add address=mqtt.next.kaaiot.com name=kaaiot port=8883 ssl=yes
Connect to the broker and check whether the connection is ongoing with the help of the "print" command ("connected=yes" should be present):
/iot/mqtt/connect broker=kaaiot

/iot/mqtt/brokers/print
0 name="kaaiot" address="mqtt.next.kaaiot.com" port=8883 ssl=yes auto-connect=no keep-alive=60 parallel-scripts-limit=off connected=yes
To post a basic JSON message:
{"test":"data"}
Simply run the command:
/iot/mqtt/publish broker=kaaiot message="{\"test\":\"data\"}" topic="kp1/<app-version>/epmx/<token>/update/keys/88"
, where you should change <app-version> (that you can check under the "Home>Devices management>Devices>Specific device" tab) and <token> (that you've generated after creating a device on the platform) to your respective values.
You should be able to see that a new "Metadata" value appeared under "Home>Device management>Devices>Specific device>Overview" tab or check logs under "Home>Device management>Devices>Specific device>Data logs" tab.
To collect /system/resource/print information and post it, we can use scripting. Copy and paste the content of the script shown below into the command line:
/system/script
add dont-require-permissions=no name=systeminfo owner=admin policy=ftp,reboot,read,write,,test,password,sniff,sensitive,romon source="#####\
############################### System ###################################\r\
\n:put (\"[*] Gathering system info...\")\r\
\n:local cpuLoad [/system/resource/get cpu-load];\r\
\n:local freeMemory [/system/resource/get free-memory];\r\
\n:local usedMemory ([/system/resource/get total-memory] - \$freeMemory);\r\
\n:local rosVersion [/system/package/get value-name=version \\\r\
\n[/system/package/find where name ~ \"^routeros\"]];\r\
\n:local model [/system/routerboard/get value-name=model];\r\
\n:local serialNumber [/system/routerboard/get value-name=serial-number];\r\
\n:local upTime [/system/resource/get uptime];\r\
\n\r\
\n#################################### message #####################################\r\
\n:local message \\\r\
\n\"{\\\"model\\\":\\\"\$model\\\",\\\r\
\n\\\"sn\\\":\\\"\$serialNumber\\\",\\\r\
\n\\\"ros\\\":\\\"\$rosVersion\\\",\\\r\
\n\\\"cpu\\\":\\\"\$cpuLoad\\\",\\\r\
\n\\\"umem\\\":\\\"\$usedMemory\\\",\\\r\
\n\\\"fmem\\\":\\\"\$freeMemory\\\",\\\r\
\n\\\"uptime\\\":\\\"\$upTime\\\"}\"\r\
\n\r\
\n:log info \"\$message\";\r\
\n:put (\"[*] Total message size: \$[:len \$message] bytes\")\r\
\n:put (\"[*] Sending message...\")\r\
\n/iot/mqtt/publish broker=kaaiot message=\$message topic=\"kp1/<app-version>/epmx/<token>/update/keys/88\"\r\
\n:put (\"[*] Done\")"
Change the topic's <app-version> and <token> values. Then, run the script using:
/system/script/run systeminfo
The JSON message will look like this:
{
  "model": "RB924iR-2nD-BT5&BG77",
  "sn": "XXXXXXX",
  "ros": "7.99",
  "cpu": "7",
  "umem": "45113344",
  "fmem": "21995520",
  "uptime": "4d22:16:08"
}
Data visualization using dashboards
To visualize previously posted data, go to "Home>Solutions>Your_Solution>Dashboards>Your_Dashboard" and click on "Add widget":
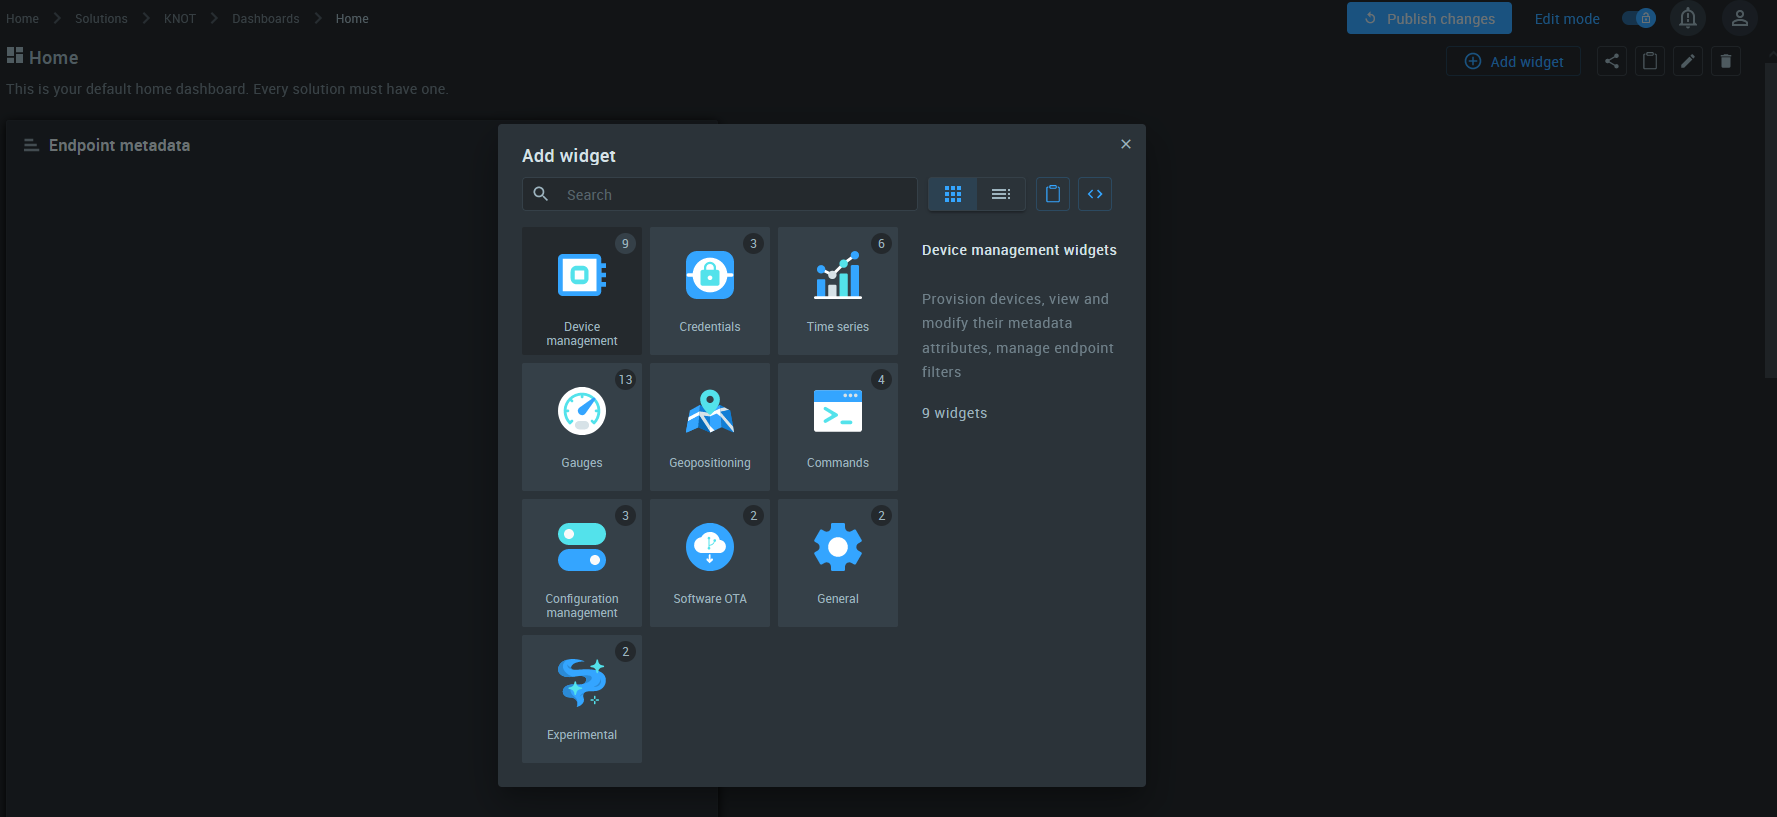
Select a widget type (we will use "Device management"), and a pre-set widget (we will use "Endpoint metadata").
"Edit" the widget and choose your "Endpoint ID" under "Data source>Endpoint ID". From here, you can customize the dashboard further:
And so, you can create your own scripts that collect information that is important to you instead, and then just apply a scheduler to run the script with an interval of your choice. Maybe you want to collect GPS coordinates from your LTAP and visualize them using the "map" widget? It is only up to you!