Graphing
Graphing is a tool to monitor various RouterOS parameters over time and put collected data in graphs.
Watch our video about this feature.
We suggest not storing graphs on disk for devices with small built-in memory.
The Graphing tool can display graphics for:
- Resource usage (CPU, Memory, and Disk usage).
- Traffic which is passed through an interface.
- Traffic which is passed through a simple queue.
Graphing consists of two parts - the first part collects information and the other part displays data on a Web page. To access the graphics, type https://[Router_IP_address]/graphs/ and choose a graphic to display in your Web browser.
Alternatively, look for the menu ≡ (triple bar sign) in the top right corner of the WebFig interface, allowing you to find "graphs":

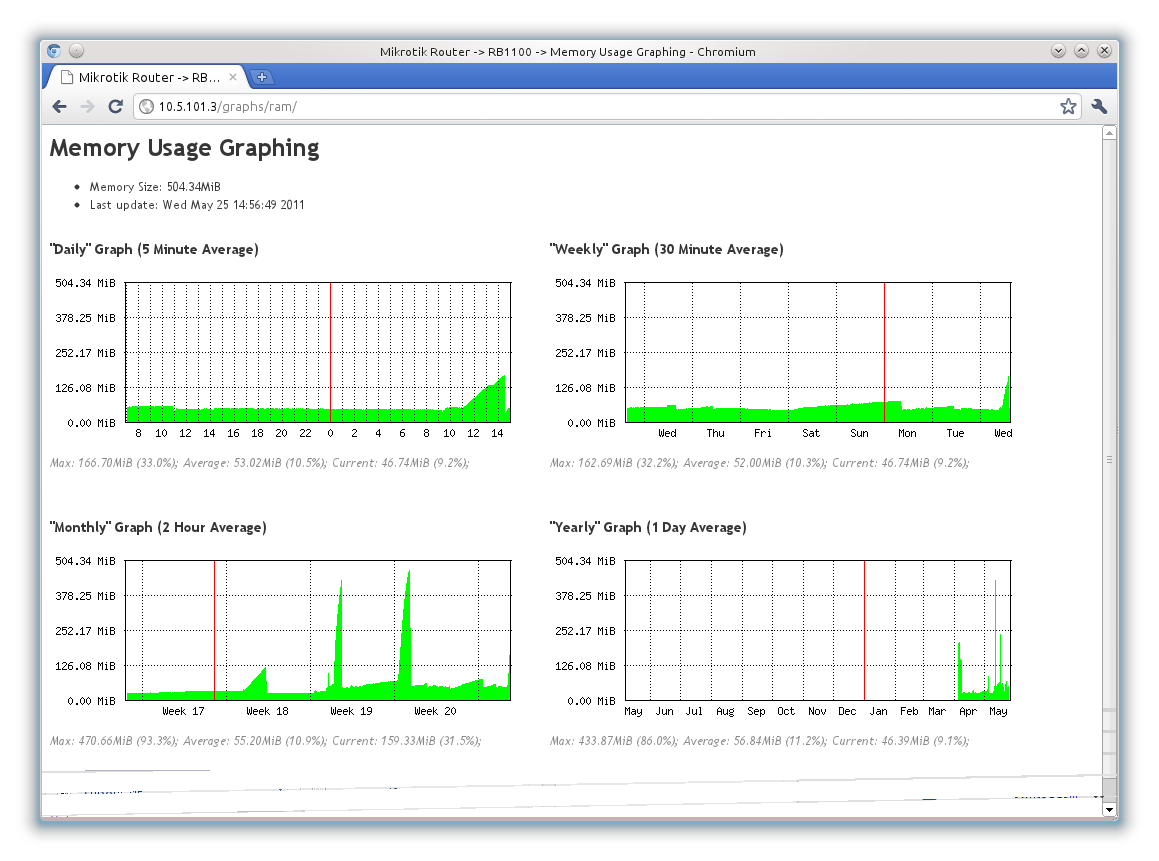
Example of memory graphs:
Configuration
General
The configuration is done under the /tool/graphing menu. By default, graphing is disabled. You can configure graphing for interfaces, resources, and simple queues in their respective submenus.
Sub-menu: /tool/graphing
| Property | Description |
|---|---|
| store-every (24hours | 5min | hour; Default: 5min) | How often to write collected data to the system drive. |
| page-refresh (integer | never; Default: 300) | How often the graph page is refreshed |
Interface graphing
The Sub-menu allows configuration for which interface graphing will collect bandwidth usage data.
Sub-menu: /tool/graphing/interface
| Property | Description |
|---|---|
| allow-address (IP/IPv6 prefix; Default: 0.0.0.0/0) | IP address range that is allowed to access graphing information |
| comment (string; Default: ) | Description of current entry |
| disabled (yes | no; Default: no) | Defines whether the item is used |
| interface (all | interface name; Default: all) | Defines which interface will be monitored. all means that all interfaces on the router will be monitored. |
| store-on-disk (yes | no; Default: yes) | Defines whether to store collected information on the system drive. |
Queue graphing
The Sub-menu allows configuration of which simple queue graphing will collect bandwidth usage data.
Sub-menu: /tool/graphing/queue
| Property | Description |
|---|---|
| allow-address (IP/IPv6 prefix; Default: 0.0.0.0/0) | IP address range that is allowed to access graphing information |
| allow-target (yes | no; Default: yes) | Whether to allow access to graphs from queue's target-address |
| comment (string; Default: ) | Description of current entry |
| disabled (yes | no; Default: no) | Defines whether item is used |
| simple-queue (all | queue name; Default: all) | Defines which queues will be monitored. all means that all queues on the router will be monitored. |
| store-on-disk (yes | no; Default: yes) | Defines whether to store collected information on the system drive. |
If a simple queue has target-address set to 0.0.0.0/0 everyone will be able to access queue graphs even if allow address is set to a specific address. This happens because by default queue graphs are accessible also from the target address.
Resource graphing
Sub-menu allows enabling graphing of system resources. Graphing collects data of:
- CPU usage
- Memory usage
- Disk usage
Sub-menu: /tool/graphing/resource
| Property | Description |
|---|---|
| allow-address (IP/IPv6 prefix; Default: 0.0.0.0/0) | IP address range that is allowed to access graphing information |
| comment (string; Default: ) | Description of current entry |
| disabled (yes | no; Default: no) | Defines whether the item is used |
| store-on-disk (yes | no; Default: yes) | Defines whether to store collected information on the system drive |
Graphing in WinBox
Winbox allows viewing the same collected information as on the web page. Open the Tools->Graphing window. Double click on the entry of which you want to see graphs.
The image below shows WinBox graphs of memory usage:
