Packet Sniffer
CLI reference:/tool/sniffer/tool/sniffer/quick/tool/sniffer/protocol/tool/sniffer/host/tool/sniffer/connection
The packet sniffer captures packets that the router receives, sends and forwards. Use it to diagnose network problems: whether a device sends a request and gets an answer, which packets arrive on an interface, or what a protocol exchange looks like. You can watch the packets live in the console, save them to a file for Wireshark, or stream them to a PC while they are captured.
The sniffer keeps the captured packets in memory, 100 KiB by default. Filters decide which packets it captures; without filters, it captures everything on every interface, which on a busy router fills the memory quickly. Captures hold the traffic of your users, so treat the files like other private data.
Capture packets and open them in Wireshark
A computer at 192.168.88.50 cannot open a website. Start the sniffer on the LAN bridge with a filter for the computer's address, reproduce the problem, stop the sniffer and save the packets to a file:
/tool/sniffer/start interface= ip-address=192.168.88.50/32
/tool/sniffer/stop
/tool/sniffer/save file-name=capture.pcap
Capture on the LAN side: on the WAN interface, source NAT has already replaced the computer's address with the router's.
Download capture.pcap from the router's files (the Files menu in WinBox or WebFig, or scp admin@192.168.88.1:capture.pcap .) and open it in Wireshark. The file is in pcapng format, whatever its extension, and records for each packet the interface, the direction and a timestamp with nanosecond resolution.
To write the packets to a file while the sniffer runs, set the file name first:
/tool/sniffer/set file-name=capture.pcap file-limit=10000KiB
/tool/sniffer/start interface= ip-address=192.168.88.50/32
Each start overwrites the file. When the file reaches file-limit, the sniffer stops writing to it but keeps running. For long captures, write the file to a USB disk or a RAM disk instead of the router's flash, with a path such as file-name=usb1/capture.pcap. To stop writing a file, set file-name="".
Watch packets live
quick shows matching packets in the console as they arrive, without changing the settings. It runs until you press Q, or for duration; proplist selects the columns. To see whether the router's DHCP client on ether1 gets answers, filter by port: a DHCP client starts without an address, so an address filter misses its first packets:
/tool/sniffer/quick interface=ether1 port=bootps,bootpc duration=10s \
proplist=time,dir,src-,dst-,size
Columns: TIME, DIR, SRC-ADDRESS, DST-ADDRESS, SIZE
TIME      DIR  SRC-ADDRESS                DST-ADDRESS                SIZE
4.922348  ->   192.168.88.24:68 (bootpc)  192.168.88.1:67 (bootps)    342
4.923657  <-   192.168.88.1:67 (bootps)   192.168.88.24:68 (bootpc)   342
TIME counts seconds since the start, <- marks received and -> sent packets. Without interface, a packet to or from the router through a bridge appears twice: once on the bridge and once on the bridge port. quick does not run while the sniffer is started.
Look at a capture in the console
After stop, the captured packets stay in memory for 10 minutes, or until the next start, and four menus show them. Save them to a file to keep them longer:
/tool/sniffer/packet/print
Columns: TIME, INTERFACE, SRC-ADDRESS, DST-ADDRESS, IP-PROTOCOL, SIZE, CPU
#  TIME      INTERFACE  SRC-ADDRESS    DST-ADDRESS    IP-PROTOCOL  SIZE  CPU
0  1.191491  bridge     192.168.88.1   192.168.88.10  icmp           70    3
1  1.191726  bridge     192.168.88.10  192.168.88.1   icmp           70    0
2  2.193866  bridge     192.168.88.1   192.168.88.10  icmp           70    2
3  2.194027  bridge     192.168.88.10  192.168.88.1   icmp           70    0
/tool/sniffer/protocol/print counts the packets and bytes per protocol, IP protocol and port, with their share of the capture. /tool/sniffer/host/print shows the rate, peak rate and total bytes per address, each as two values: to the address and from it. The rates are calculated when the capture stops:
Columns: ADDRESS, RATE, PEAK-RATE, TOTAL
#  ADDRESS        RATE           PEAK-RATE      TOTAL
0  192.168.88.1   560bps/560bps  560bps/560bps  280/280
1  192.168.88.10  560bps/560bps  560bps/560bps  280/280
/tool/sniffer/connection/print lists the TCP connections with their bytes, resends and MSS in each direction:
Columns: SRC-ADDRESS, DST-ADDRESS, BYTES, RESENDS, MSS
# SRC-ADDRESS          DST-ADDRESS              BYTES     RESENDS  MSS
0 192.168.88.1:55042   192.168.88.10:80 (http)  104/1536  0/0      1460/1460
To see which hosts use the most bandwidth right now, use Torch instead: it shows the rates live.
Stream packets to Wireshark
The sniffer can send every captured packet to a PC over the TaZmen Sniffer Protocol (TZSP), so Wireshark shows the packets while they are captured. Set the PC's address as streaming-server (the port defaults to 37008) and turn on filter-stream:
/tool/sniffer/set streaming-enabled=yes streaming-server=192.168.88.10 \
    filter-stream=yes
/tool/sniffer/start interface=ether1
With only interface given, the sniffer streams all traffic of ether1. Each captured packet crosses the network again inside an unencrypted UDP packet, so streaming a busy interface loads the path to the PC.
filter-stream=yes keeps the sniffer from capturing its own stream packets. Without it (the default is no), when the stream leaves through a sniffed interface, the sniffer captures the stream packets and streams them again, in a loop. With yes, the sniffer also leaves out ICMP packets to and from the PC, even while streaming is off.
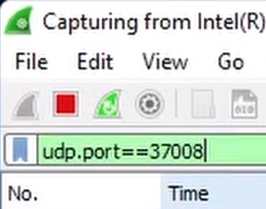
In Wireshark, capture on the PC's network interface with the capture filter udp port 37008, or show only the stream with the display filter udp.port==37008. Wireshark decodes the TZSP packets and shows the captured frames inside:
To stop streaming, set streaming-enabled=no; the setting stays until you change it.
Choose what to capture
Set the filters with /tool/sniffer/set to keep them for every capture, or give them to start or quick for one run. The arguments are the filter names without filter- (interface, ip-address, port), and vlan-id for filter-vlan. With arguments, only the filters given apply: saved filters that you do not repeat are ignored for that run. Without arguments, the saved filters apply, so check them with /tool/sniffer/print, and clear all settings with /tool/sniffer/reset.
filter-interface- The interfaces to sniff. Empty means all interfaces.filter-ip-address,filter-src-ip-address,filter-dst-ip-addressand the IPv6 and MAC address variants - Addresses in either direction, as source or as destination. For one direction of a flow, use the source and destination filters.filter-port,filter-src-port,filter-dst-port- Ports, by number or name (ssh,dns,bootps).filter-ip-protocol,filter-mac-protocol- Protocols, by name or number.filter-vlan- VLAN IDs of tagged frames on the port that carries them. The address and protocol filters match the packet inside the tag. On the VLAN interface itself, the packets are untagged.filter-direction-rxfor packets received on the sniffed interface,txfor sent ones,any(default) for both.filter-operator-between-entries- Withor(default), a packet that matches any entry of a filter matches; withand, it has to match all of them, for example both addresses inip-address=192.168.88.50/32,192.168.88.1/32.
Separate several values with commas, and prefix a value with ! to exclude it. Different filters always combine: a packet is captured only when it matches every filter that is set.
The sniffer keeps up to memory-limit of packets in memory. With memory-scroll=yes (default), new packets replace the oldest ones when the memory is full, so the memory holds the latest packets: stop the sniffer right after the problem appears. With no, the sniffer keeps the first packets and stores no more. only-headers=yes keeps and saves only the packet headers, which fits more packets into the same memory or file. Keep memory-limit well below the router's free memory (/system/resource/print).
For all settings, see /tool/sniffer in the CLI reference.
What the sniffer sees
- The sniffer captures received packets before the firewall and NAT, and sent packets after them. It shows packets that the firewall then drops, as received only, and it shows the addresses and ports as they are on the wire.
- While the sniffer runs, the router turns off IPv4 fast path, and with it FastTrack, so forwarded traffic takes more CPU.
- Packets that a bridge forwards in hardware (hardware offloading) never reach the router's CPU and are not captured; flooded packets, such as broadcast, multicast and unknown unicast, can be.
- Unicast traffic between wireless clients with client-to-client forwarding does not pass the sniffer.
- Packets of the traffic generator are not visible on the same interface unless its
fast-pathparameter is set.
Technical details
- The packet list shows the time in seconds since the start of the capture, with microseconds.
saveandfile-namewrite pcapng files from RouterOS 7.20; earlier versions wrote pcap. The traffic generator'sinject-pcapreads pcapng files from RouterOS 7.21.- The TZSP stream uses TZSP version 1 with Ethernet encapsulation and carries each captured frame complete.