Graphing
CLI reference:/tool/graphing/tool/graphing/interface/tool/graphing/queue/tool/graphing/resource
Graphing records how the router is used over time and draws graphs of it:
- CPU, memory and disk usage.
- Traffic through an interface.
- Traffic through a simple queue.
You see the graphs in a web browser on the router's /graphs/ page, or in WinBox. Nothing is graphed until you add a rule for it: the router has no graphing rules by default. For a walk-through, watch the graphing video on the MikroTik YouTube channel.
Graph an interface and the router's resources
To graph the internet traffic on ether1 (the WAN port of the default configuration) and the CPU, memory and disk usage, and show them only to your own computer at 192.168.88.10, add an interface rule and a resource rule:
/tool/graphing/interface/add interface=ether1 \
    allow-address=192.168.88.10/32
/tool/graphing/resource/add allow-address=192.168.88.10/32
To create the same rules in WinBox:
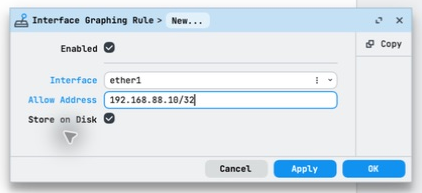
- Open Tools > Graphing and select Interface Rules.
- Select New, set Interface to
ether1, and enter192.168.88.10/32in Allow Address. Leave Enabled and Store on Disk selected, then select OK. - Select Resource Rules and New. Enter the same Allow Address, leave Enabled and Store on Disk selected, and select OK. This rule collects CPU, memory and disk usage together.
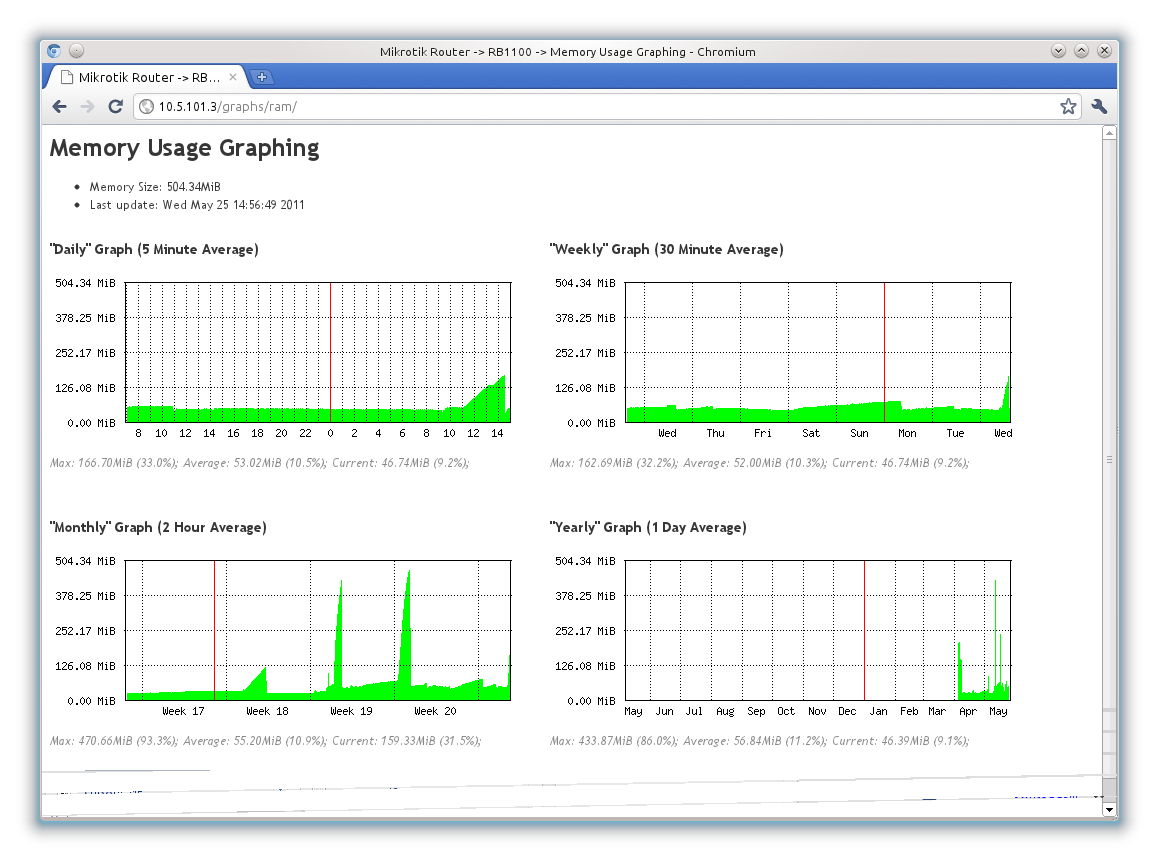
Open https://192.168.88.1/graphs/ in a web browser on that computer. The page lists the graphs your address can see: CPU usage, Memory usage, Disk usage and ether1. Each graph page has four graphs:
- Daily graph - 5-minute averages.
- Weekly graph - 30-minute averages.
- Monthly graph - 2-hour averages.
- Yearly graph - 1-day averages.
The first values appear within a few minutes, when the first 5-minute average is complete. Under each graph, the page shows the maximum, average and current value. Traffic graphs are in bits per second, with separate values for incoming (In, received on the interface) and outgoing (Out, sent) traffic. Every value is an average over the graph's interval, so a short burst shows lower than its peak.
To graph every interface, add a rule with interface=all.
Graph simple queues
If you limit each customer with a simple queue, you can graph every queue and let each customer see the graph of their own queue. For example, with these customer queues:
/queue/simple/add name=customer-12 target=192.168.88.12/32 \
    max-limit=20M/20M
/queue/simple/add name=customer-13 target=192.168.88.13/32 \
    max-limit=50M/50M
Graph all simple queues and let the operator's computer, 192.168.88.10, see every graph:
/tool/graphing/queue/add simple-queue=all allow-address=192.168.88.10/32
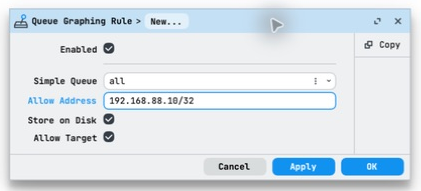
In WinBox, open Tools > Graphing > Queue Rules and select New. Set Simple Queue to all and Allow Address to 192.168.88.10/32. Leave Enabled, Store on Disk, and Allow Target selected, then select OK. To graph one queue, select its name in Simple Queue instead.
simple-queue=all also graphs the queues you add later and the dynamic queues of PPP users. With allow-target=yes (default), every address in a queue's target also sees that queue's graph. The customer at 192.168.88.12 opens https://192.168.88.1/graphs/ and finds the customer-12 graph there, but not the graphs of the other customers. In a queue graph, In is the traffic to the target (the customer's download) and Out the traffic from it (upload), each also as a share of the queue's max-limit.
With allow-target=yes, a queue with a wide target shows its graph to everyone in it: a parent queue with the target 192.168.88.0/24 to the whole subnet, and a queue whose target is 0.0.0.0/0 or an interface to every client that reaches the router's web server. The dynamic queues of PPPoE and other PPP users have their interface as the target. Another rule for the same queue with allow-target=no does not hide the graph, because a client sees a graph when any rule allows it. When such queues exist, set allow-target=no on the simple-queue=all rule, and add a rule with allow-target=yes for each customer queue that should be visible to its customer.
Graph PPPoE users
interface=all graphs the dynamic interface of each PPPoE user, such as <pppoe-customer-12> for the user customer-12, while the user is connected, and the index lists it again after the user reconnects. A rule for one dynamic interface does not survive a reconnect: the interface gets a new ID, and the rule shows an unknown interface such as *F00000. To graph one user permanently, create a static PPPoE server binding for the user, with service set to the service-name of your PPPoE server, and graph the binding:
/interface/pppoe-server/add name=pppoe-customer-12 user=customer-12 \
    service=isp
/tool/graphing/interface/add interface=pppoe-customer-12 \
    allow-address=192.168.88.10/32
Control who can see the graphs
The graph pages need no login. A client sees a graph when its address is in the allow-address of a rule for that graph. The default allow-address=0.0.0.0/0 allows every IPv4 address, so always set it to the addresses that need the graphs. A change of allow-address applies immediately:
/tool/graphing/interface/set [find] allow-address=192.168.88.10/32
- Access is per graph type: an interface rule opens the graphs of its interfaces, a resource rule the CPU, memory and disk graphs, and a queue rule the graphs of its queues.
- To allow several address ranges, add a rule for each range. You can add several rules for the same interface, queue or the resources, each with its own
allow-address. - The
/graphs/page lists only the graphs your address can see. A graph page you are not allowed to see showsERROR: NO ACCESS!; a graph that does not exist showsERROR: INVALID ID!. - A disabled rule does not show its graphs.
- The
interfaceorsimple-queueof a rule cannot be changed: remove the rule and add a new one.
The graphs are served by the router's web server, on HTTP by the www service and on HTTPS by www-ssl, which needs a certificate. The firewall of the default configuration drops connections to the router from the internet, so the graphs are reachable only from the LAN. To limit which addresses can reach the web server at all (WebFig and the REST API included), set available-from of these services in Services.
To show the graphs to customers without the WebFig login page, turn off WebFig in /ip/service/webserver and manage the router with WinBox or SSH:
/ip/service/webserver/set webfig-plain=no webfig-secure=no
To turn off the graph pages and keep the rest of the web server:
/ip/service/webserver/set graphs-plain=no graphs-secure=no
Keep the graphs across reboots
With store-on-disk=yes (default), the router writes the collected data to its built-in storage, where its files are, and the graphs survive a reboot. With store-on-disk=no, the data stays in RAM, and the graph starts empty after a reboot. The router cannot write graph data to a USB or SD disk.
store-every sets how often the router writes the collected data: every 5 minutes (default), every hour or once a day. A reboot from RouterOS keeps the data collected since the last write. The setting applies to all rules:
/tool/graphing/set store-every=hour
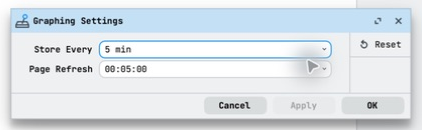
In WinBox, open Tools > Graphing, select Interface Rules, and select Graphing Settings in the right panel. Choose the write interval in Store Every and select OK. Page Refresh controls how often the browser reloads the web graph pages; it does not change the data collection interval. The screenshot shows the default values.
To change whether a rule keeps its data across reboots, open the rule in Interface Rules, Queue Rules, or Resource Rules, change Store on Disk, and select OK.
On a device with a small flash storage, every rule with store-on-disk=yes adds data and writes to the flash. Set store-on-disk=no on the rules whose graphs you do not need after a reboot, for example a rule with interface=all.
Graphs in WinBox
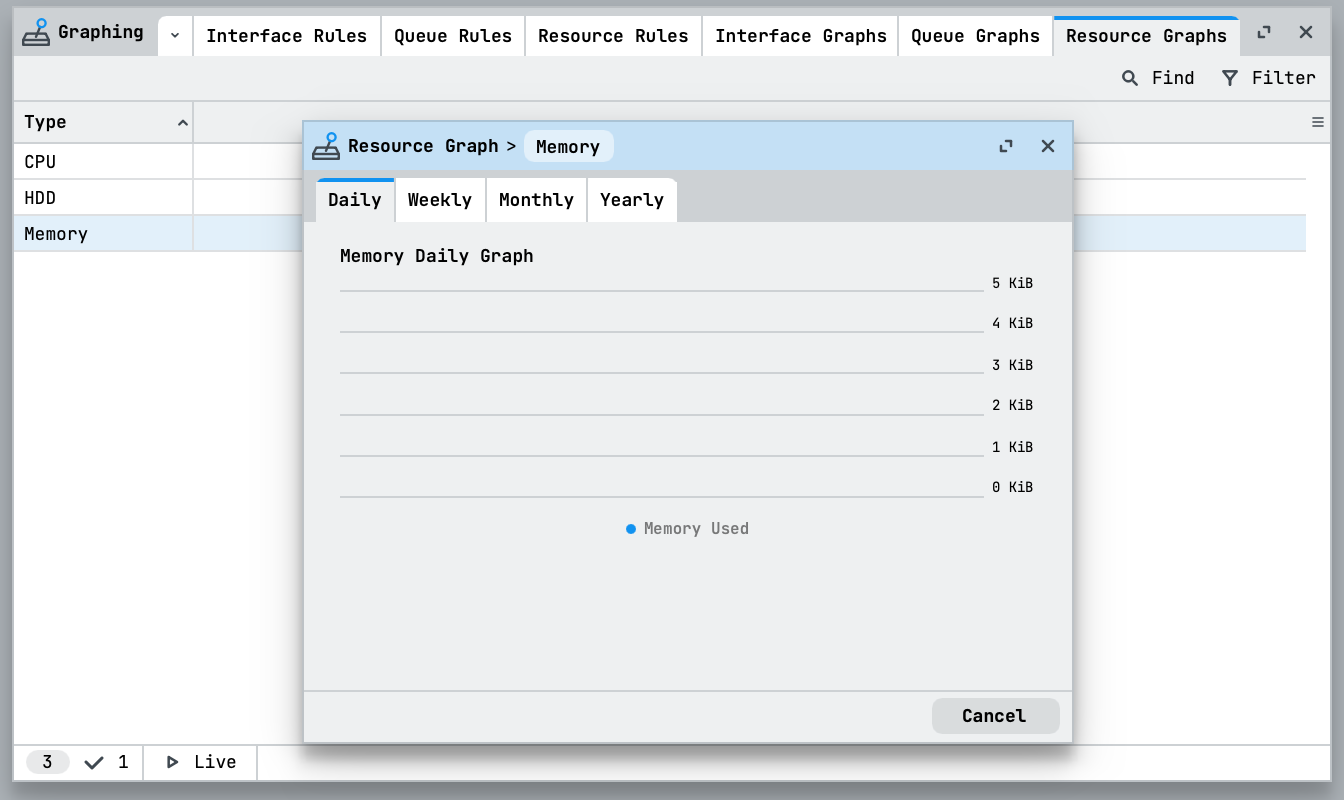
WinBox shows the same graphs. Open Tools > Graphing, select the Interface Graphs, Queue Graphs or Resource Graphs tab, and open an entry. Select Daily, Weekly, Monthly, or Yearly in the graph window to change the time range. Drag the window edge to enlarge the graph.
Troubleshoot the graphs
/graphs/lists no graphs - No rule exists, or none allows your address. Checkallow-addresswith/tool/graphing/interface/print,/tool/graphing/queue/printand/tool/graphing/resource/print.- A new interface graph is missing, or its page shows
ERROR: INVALID ID!- The graph can take a few minutes to appear after you add the rule. To show it at once, disable and enable the rule. - A graph page shows
ERROR: NO ACCESS!- The rules for that graph do not allow your address. For a queue graph, your address can also be in the queue'stargetwhen the rule hasallow-target=yes. Can't change interface, please create new configorCan't change queue, please create new config- The interface or queue of a rule cannot be changed. Remove the rule and add a new one.- The graphs are empty after a reboot - The rule has
store-on-disk=no. - A rule shows an interface such as
*F00000- The rule named a dynamic interface, such as a PPPoE user, that has reconnected. Graph the user through a static PPPoE server binding. /graphs/answers403 Forbidden- The graph pages are turned off withgraphs-plain(HTTP) orgraphs-secure(HTTPS) in/ip/service/webserver.
Technical details
Web pages
/graphs/- The list of graphs the client can see./graphs/cpu/,/graphs/ram/,/graphs/hdd/- CPU, memory and disk usage./graphs/iface/<interface>/- Traffic of an interface./graphs/queue/<queue>/- Traffic of a simple queue.
The index links the names URL-encoded, for example /graphs/queue/customer%2D12/; the plain name works too. A queue page also shows the queue's target, max-limit and limit-at. Each graph page loads its graphs as GIF images from its own folder: daily.gif, weekly.gif, monthly.gif and yearly.gif. The pages send the page-refresh value (default 300 seconds) as the HTTP refresh header, so the browser reloads them; with page-refresh=never, the header is left out. A page the client is not allowed to see answers with HTTP status 200 and the text ERROR: NO ACCESS! or ERROR: INVALID ID!, not with an HTTP error.
Rules
- A rule without
interfaceorsimple-queueapplies toall. - A second rule with the same interface or queue and the same
allow-addressis refused withGraphing rule already exists. interface=allgraphs every interface, also disabled ones and the loopback interfacelo.- Graphing rules have no comment: a
commentgiven toaddis not kept.
For all settings, see /tool/graphing in the CLI reference.