Netwatch
CLI reference:/tool/netwatch
Netwatch monitors the state of hosts on the network. Monitoring can be done with the following probe types:
- Simple - Uses ping, without the use of advanced metrics
- ICMP - Pings to a specified IP address - hosts, with an option to adjust threshold values
- TCP-conn - Tests the TCP connection
- HTTP-GET - Sends a request to a server you are monitoring
- HTTPS-GET - Sends a request to a server you are monitoring
- DNS - Sends a DNS query to a DNS server and checks for a response.
General configuration information
This section covers information that is relevant to all Netwatch probe types.
-
Default Netwatch values are always used - even if they were not defined by the user. Configurable variables list with default values and read-only/statistics variables can be seen on a Netwatch CLI-reference page. Make sure to check the if the default variables are appropriate for your use case.
-
For all probe types, the
hostvariable is mandatory, as it defines address of the device that should be monitored. -
Netwatch probes can execute scripts depending on probe status changes, allowing RouterOS to dynamically adjust the router configuration or send notifications (for more information, see the scripting documentation). Netwatch supports three script types, each executed under different conditions:
up-scriptis executed when the status changes from Unknown (depending on theignore-initial-upvariable; see the CLI Reference for more information) or Down to Up;down-scriptis executed when the status changes from Unknown (depending on theignore-initial-downvariable; see the CLI Reference for more information) or Up to Down;test-scriptis executed during every probe test.
-
If no scripts are specified for the probe, it is still possible to observe probe status changes in the log. Probe identification information and status changes are printed to the log when
infotopic logging is enabled. Detailed probe stats and config are printed todebugtopic level. -
You can view statistics and use these variables in scripting. Keep in mind that variables containing "-" must be written like this, for example, "done-tests" would be $"done-tests"
-
Netwatch executes scripts as *sys user, so any defined global variable in the Netwatch script will not be readable by, for example, a scheduler or other users.
-
Netwatch is limited to read,write,test,reboot script policies. If the owner of the script does not have enough permissions to execute a certain command in the script, then the script will not be executed. If the script has greater policies than read,write,test,reboot - then the script will not be executed as well. Make sure your scripts do not exceed the mentioned policies.
-
It is possible to disable permission checking for RouterOS scripts under the
/system/scriptsmenu (scripting documentation). This is useful when Netwatch does not have enough permissions to execute a script, though this decreases overall security. It is recommended to assign proper permissions to a script instead. -
Simple, ICMP, HTTP, and TCP-connect probes are sent with the "don't fragment" flag set. With an ICMP probe, you can set
packet-size, which in combination with the DF flag, can be used to aid with path MTU discovery.
Simple probe
Periodically sends a simple ICMP ping request to check host availability. Only general probe parameters apply to this probe type.
Configuration Example
Simple probe configuration that checks Google DNS service, with scripts that log change of the probe status.
/tool/netwatch/add host=8.8.8.8 up-script=":log info \"Ping to 8.8.8.8 successful\"" down-script=":log info \"Ping to 8.8.8.8 failed\""
In this example, a simple probe is configured to check whether 8.8.8.8 is reachable by ping. When the probe status changes, a log entry is created depending on the type of status change.
Below, you can see the same configuration example shown in the WinBox view instead of CLI.
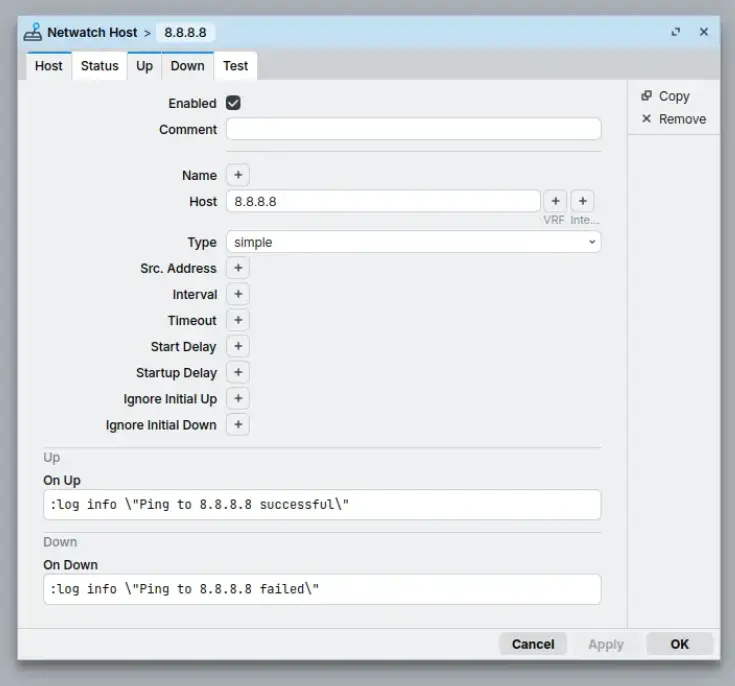
In the logging section, you can see that Netwatch executed the script. The example below shows up-script execution and the Netwatch status change. In this case, logging for the info topic must be enabled for these log entries to appear.
[admin@MikroTik] > /log/print where message~"8.8.8.8"
2026-06-10 14:48:17 netwatch,info event up [ : simple, host: 8.8.8.8 ]
2026-06-10 14:48:17 ,info Ping to 8.8.8.8 successful
ICMP probe
A more advanced version of the simple probe type that also uses ICMP packets to check the state of the host. Compared to the simple probe type, ICMP allows more complex threshold configuration and can send multiple ICMP ping packets instead of only one.
Configuration Example
This example shows how to use ICMP probe thresholds, this example uses thr-avg threshold to monitor average round trip time to the server.
/tool/netwatch/add host=8.8.8.8 type=icmp thr-avg=10ms up-script=":log info \"rtt average is \$\"rtt-avg\", threshold passed, ping to 8\
.8.8.8 successful\"" down-script=":if (\$\"loss-percent\" < 85) do={ :log info \"rtt average i\
s \$\"rtt-avg\", which is higher then threshold, please check \" } else={ :\
log info \"Ping to 8.8.8.8 failed\"}"
The probe checks whether 8.8.8.8 is reachable by ping and additionally verifies that the rtt-avg value is less than 10 ms. Both up-script and down-script log the rtt-avg value upon execution, except when down-script is triggered by packet loss of 85% or higher. This distinguishes between probe failures caused by packet loss and failures caused by the configured threshold not being met.
Below, you can see the same configuration example shown in the WinBox view instead of CLI.
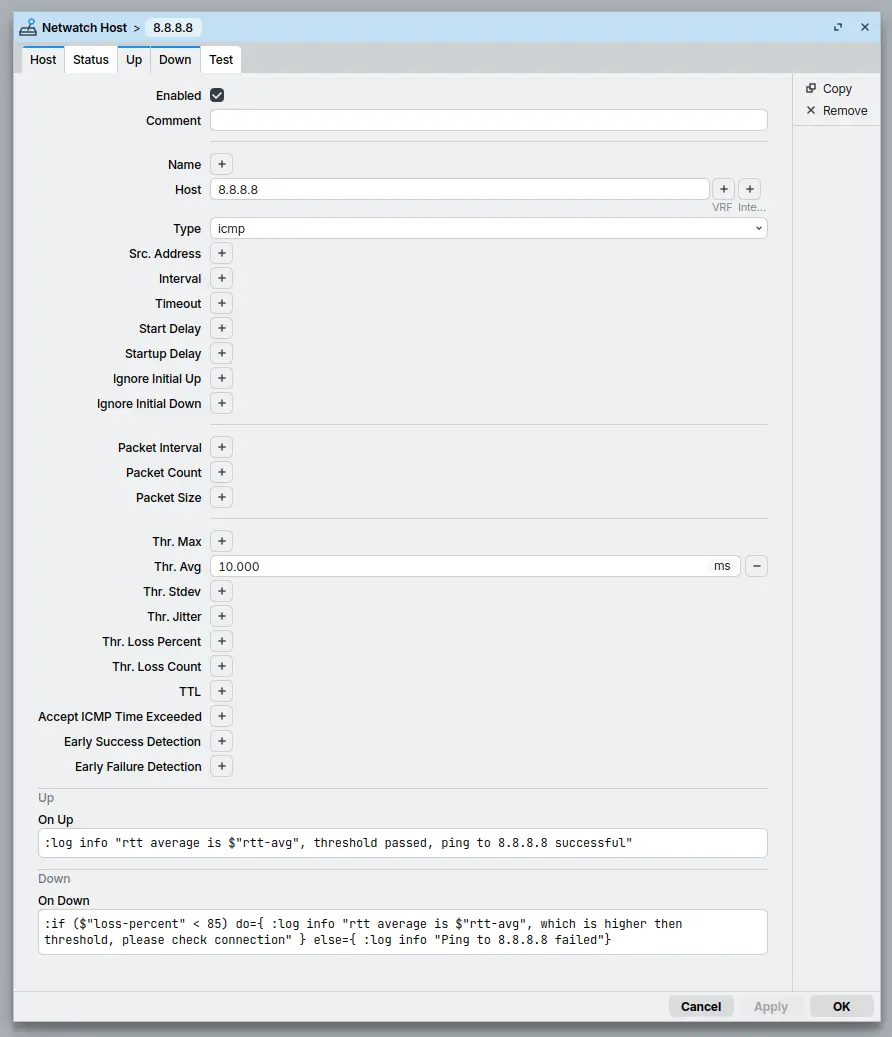
The example below shows up-script execution and the Netwatch status change. As shown, the average RTT value is passed as a raw value in microseconds, so make sure to take this into account when writing Netwatch scripts.
2026-06-17 10:31:01 netwatch,info event up [ : icmp, host: 8.8.8.8 ]
2026-06-17 10:31:01 ,info rtt average is 7686, threshold passed, ping to 8.8.8.8 successful
TCP-conn probe
The tcp-conn probe type checks whether the router can establish a TCP connection to a host on a specific TCP port. This allows monitoring of a specific service on the device instead of general device availability through ICMP.
Configuration Example
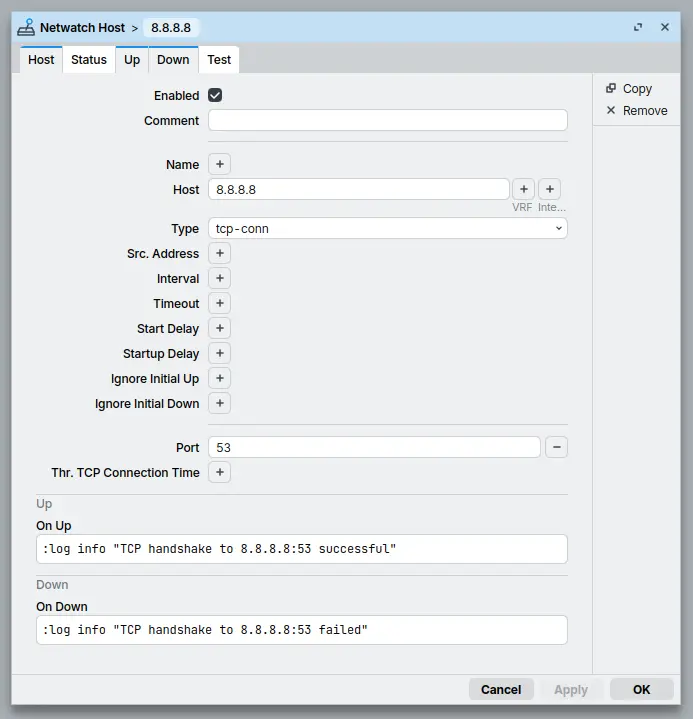
This example uses the tcp-conn probe type to check if 8.8.8.8 has its DNS port operational.
/tool/netwatch/add host=8.8.8.8 type=tcp-conn port=53 up-script=":log info \"TCP handshake to 8.8.8.8:53 successful\"" down-script=":log info \"TCP handshake to 8.8.8.8:53 failed\""
The tcp-conn probe specifically checks if TCP port 53 (DNS port) is able to complete TCP handshake with the router.
Below, you can see the same configuration example shown in the WinBox view instead of CLI.
HTTP-GET probe
http-get probe performs an HTTP-GET request to a specified host and verifies the returned HTTP status code and response time. Unlike ICMP or TCP probes, it validates application-layer availability, ensuring the web service is actually responding. A probe is considered successful when the response code falls within the configured http-codes range and the response time is within configured thresholds. Commonly used for monitoring website or API availability.
Configuration Example
In this example, the probe tries to get an HTTP response from mikrotik.com at 159.148.172.205 and logs the response code.
/tool/netwatch/add host=159.148.172.205 type=http-get down-script=":log info \"Probe down, response code: \$\"http-status-code\"\"" up-script=":log info \"Probe up, response code: \$\"http-status-code\"\""
Below, you can see the same configuration example shown in the WinBox view instead of CLI.
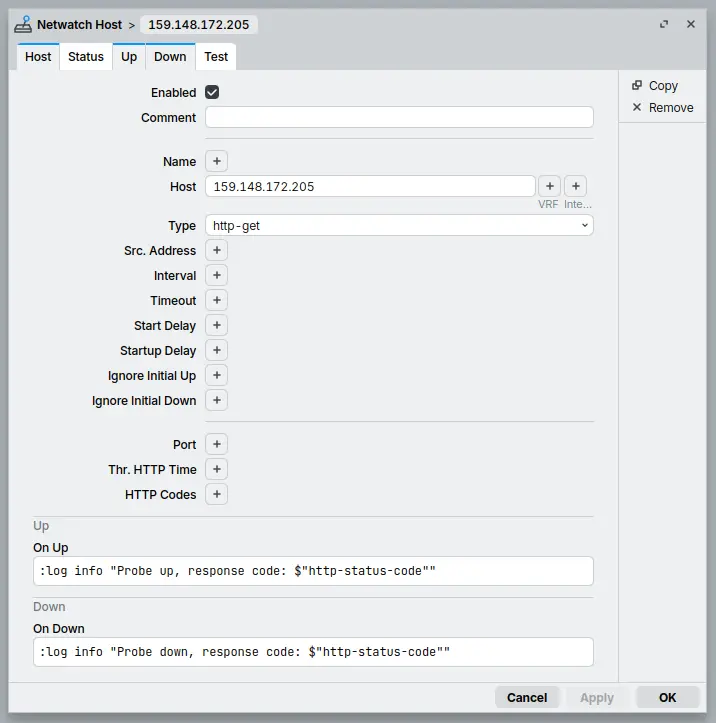
In this log example you can see that the probe went down as it did not meet the status code threshold of 100-299 and received code 302, because mikrotik.com tried to redirect the probe to HTTPS.
2026-06-19 14:09:26 netwatch,info event down [ : http_get, host: 159.148.172.205 ]
2026-06-19 14:09:26 ,info Probe down, response code: 302
HTTPS-GET probe
The https-get probe type is identical to the http-get probe type, with the only difference being that it uses HTTPS instead of HTTP. For example, this allows the probe to perform additional TLS/SSL certificate validation checks.
Configuration Example
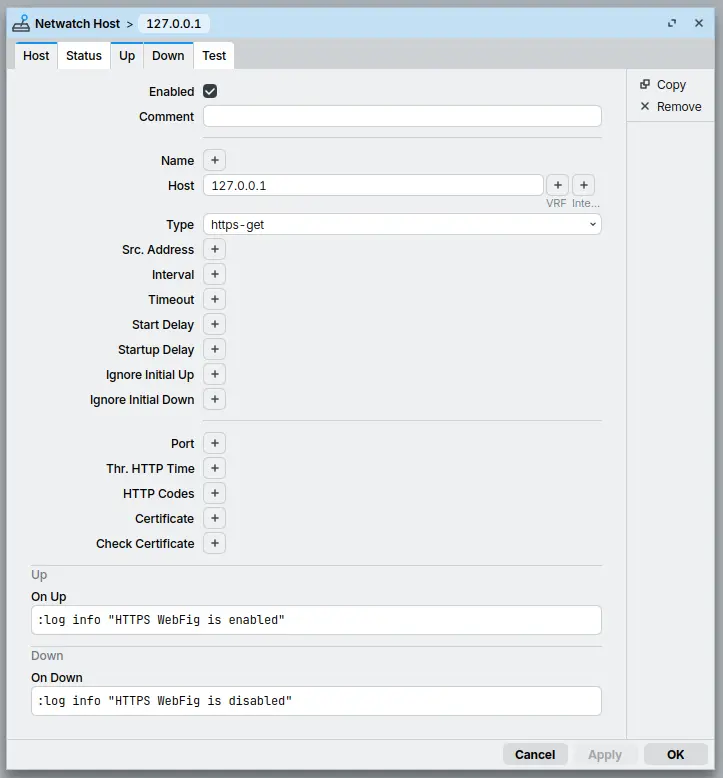
In this example, the probe monitors the www-ssl service on the router itself. The www-ssl service is used to provide HTTPS access to the router through WebFig. (more info)
/tool/netwatch/add host=127.0.0.1 type=https-get down-script=":log info \"HTTPS WebFig is disabled\"" up-script=":log info \"HTTPS WebFig is enabled\""
The probe attempts to retrieve an HTTPS response from the router's local address (127.0.0.1). For this probe to work correctly, make sure that the www-ssl service is configured with a valid TLS/SSL certificate.
Below, you can see the same configuration example shown in the WinBox view instead of CLI.
DNS probe
The dns probe type checks whether a specified domain name can be resolved by a DNS server. If the DNS server returns a valid record for the requested domain name, the probe is considered Up.
Configuration Example
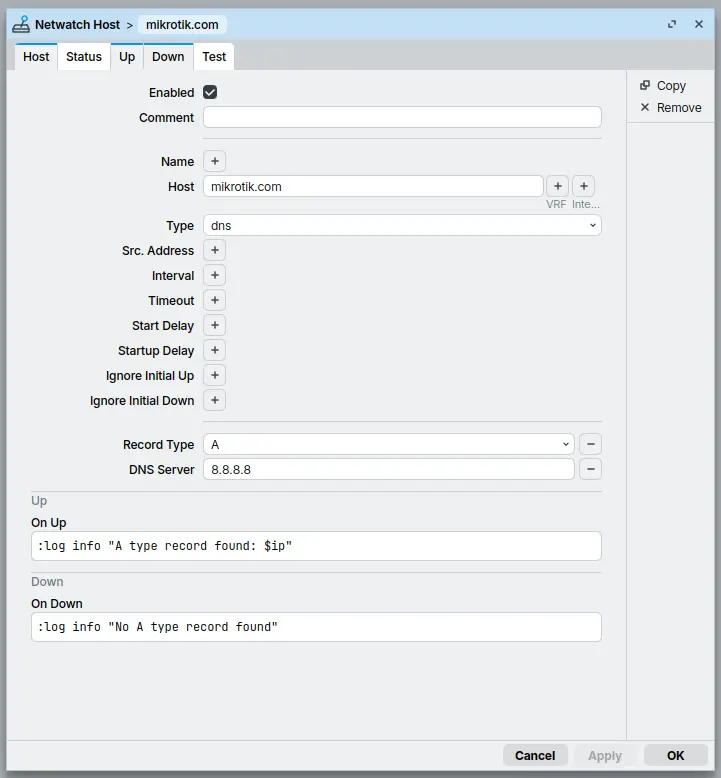
In this configuration example, the probe checks for an A record for mikrotik.com using Google's public DNS server.
/tool/netwatch/add host=mikrotik.com type= dns-server=8.8.8.8 record-type=A down-script=":log info \"No A type record found\"" up-script=":log info \"A type record found: \$ip\""
As shown, host is set to mikrotik.com, dns-server is configured as 8.8.8.8 to override the DNS server configured in /ip/dns, and record-type is set to A to query IPv4 address records.
Below, you can see the same configuration example shown in the WinBox view instead of CLI.
The example below shows up-script execution and the Netwatch status change.
2026-06-29 10:10:55 netwatch,info event up [ : , host: mikrotik.com ]
2026-06-29 10:10:55 ,info A record found: 159.148.172.205